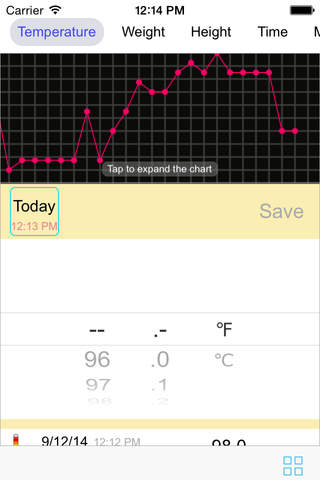
Simple charts provide an easy way to record your daily health/activity data. You can use it to record your body temperature, weight, height, your blood pressure, the miles you run, the laps you swim, or the time you spend. Each time you record something, the date and time is automatically created for this record. If you want to change, just click on the Date button then choose your preferred date/time. For each category, we provide several units for user to choose from. User can easily convert from unit A to unit B. For example, on day 1, user may choose to record his temperature in Fahrenheit. On day 2, he can choose to record in celsius. User can choose to view the data in one unit or another. The conversion will be done for you automatically. User can view his history records by scrolling to the bottom of the screen. When he clicks on a record, that record will be highlighted in the chart. So user can clearly see the position of that record in the chart. User can change/update record details by clicking the "Edit" button in the record table. You can also scroll the chart left and right when the data points exceed the display screen. By clicking the chart, you can see the detailed chart info. User can choose to send this chart in pdf format via email.
Features:
convert units seamlessly
show or hide history data
interactive chart
send chart via email in pdf format
password set up for sensitive chart data
What separates this app from other health apps is how easy to use it. The user interface is carefully designed to make sure user has a streamlined experience. Give it a try, I am sure you will like it. Any feedback is welcome. Thanks.


